Our brains were not designed to comprehend vast amounts of written information. Visualization helps us see the story the data is telling, enabling highly effective reporting practices. Being able to successfully communicate data insights is critical to understanding outcomes of business practices, making informed decisions, and increasing revenue.
What’s ahead: In this article, we’ll cover:
- What is data visualization
- Why is data visualization important?
- Types of data visualization
- 5 Ways visualization can up your reporting
- More Effective Reporting – Visuals are processed faster/support visual learners
- Data Storytelling – Visualization helps presenter make a more compelling case
- Faster Report Generation – Easier and less time consuming for data analyst/report presenter to compile the information
- Actionable insights – Easily illuminate successes and areas in need of improvement
- Helps increase revenue – More informed decisions lead to fewer mistakes and more profitable processes
Data Visualization
Data visualization is the process that translates large and complex datasets and summarizes in a visual format. Simply, it’s the graphical representation of information and data.
Why is data visualization important?
To an organization, data visualization has become incredibly important for several reasons. Data visualization helps organizations to improve their understanding of data by identifying different trends, patterns, and outliers. Leadership can hasten their decision making through more accurate analyses.
When presented visually, the data is not only nicer to look at, but easier to understand. As opposed to traditional data, visualization is friendlier and more natural for the mind to comprehend.
Types of data visualization
- Tables: Tables can show a great deal of information in a structured way
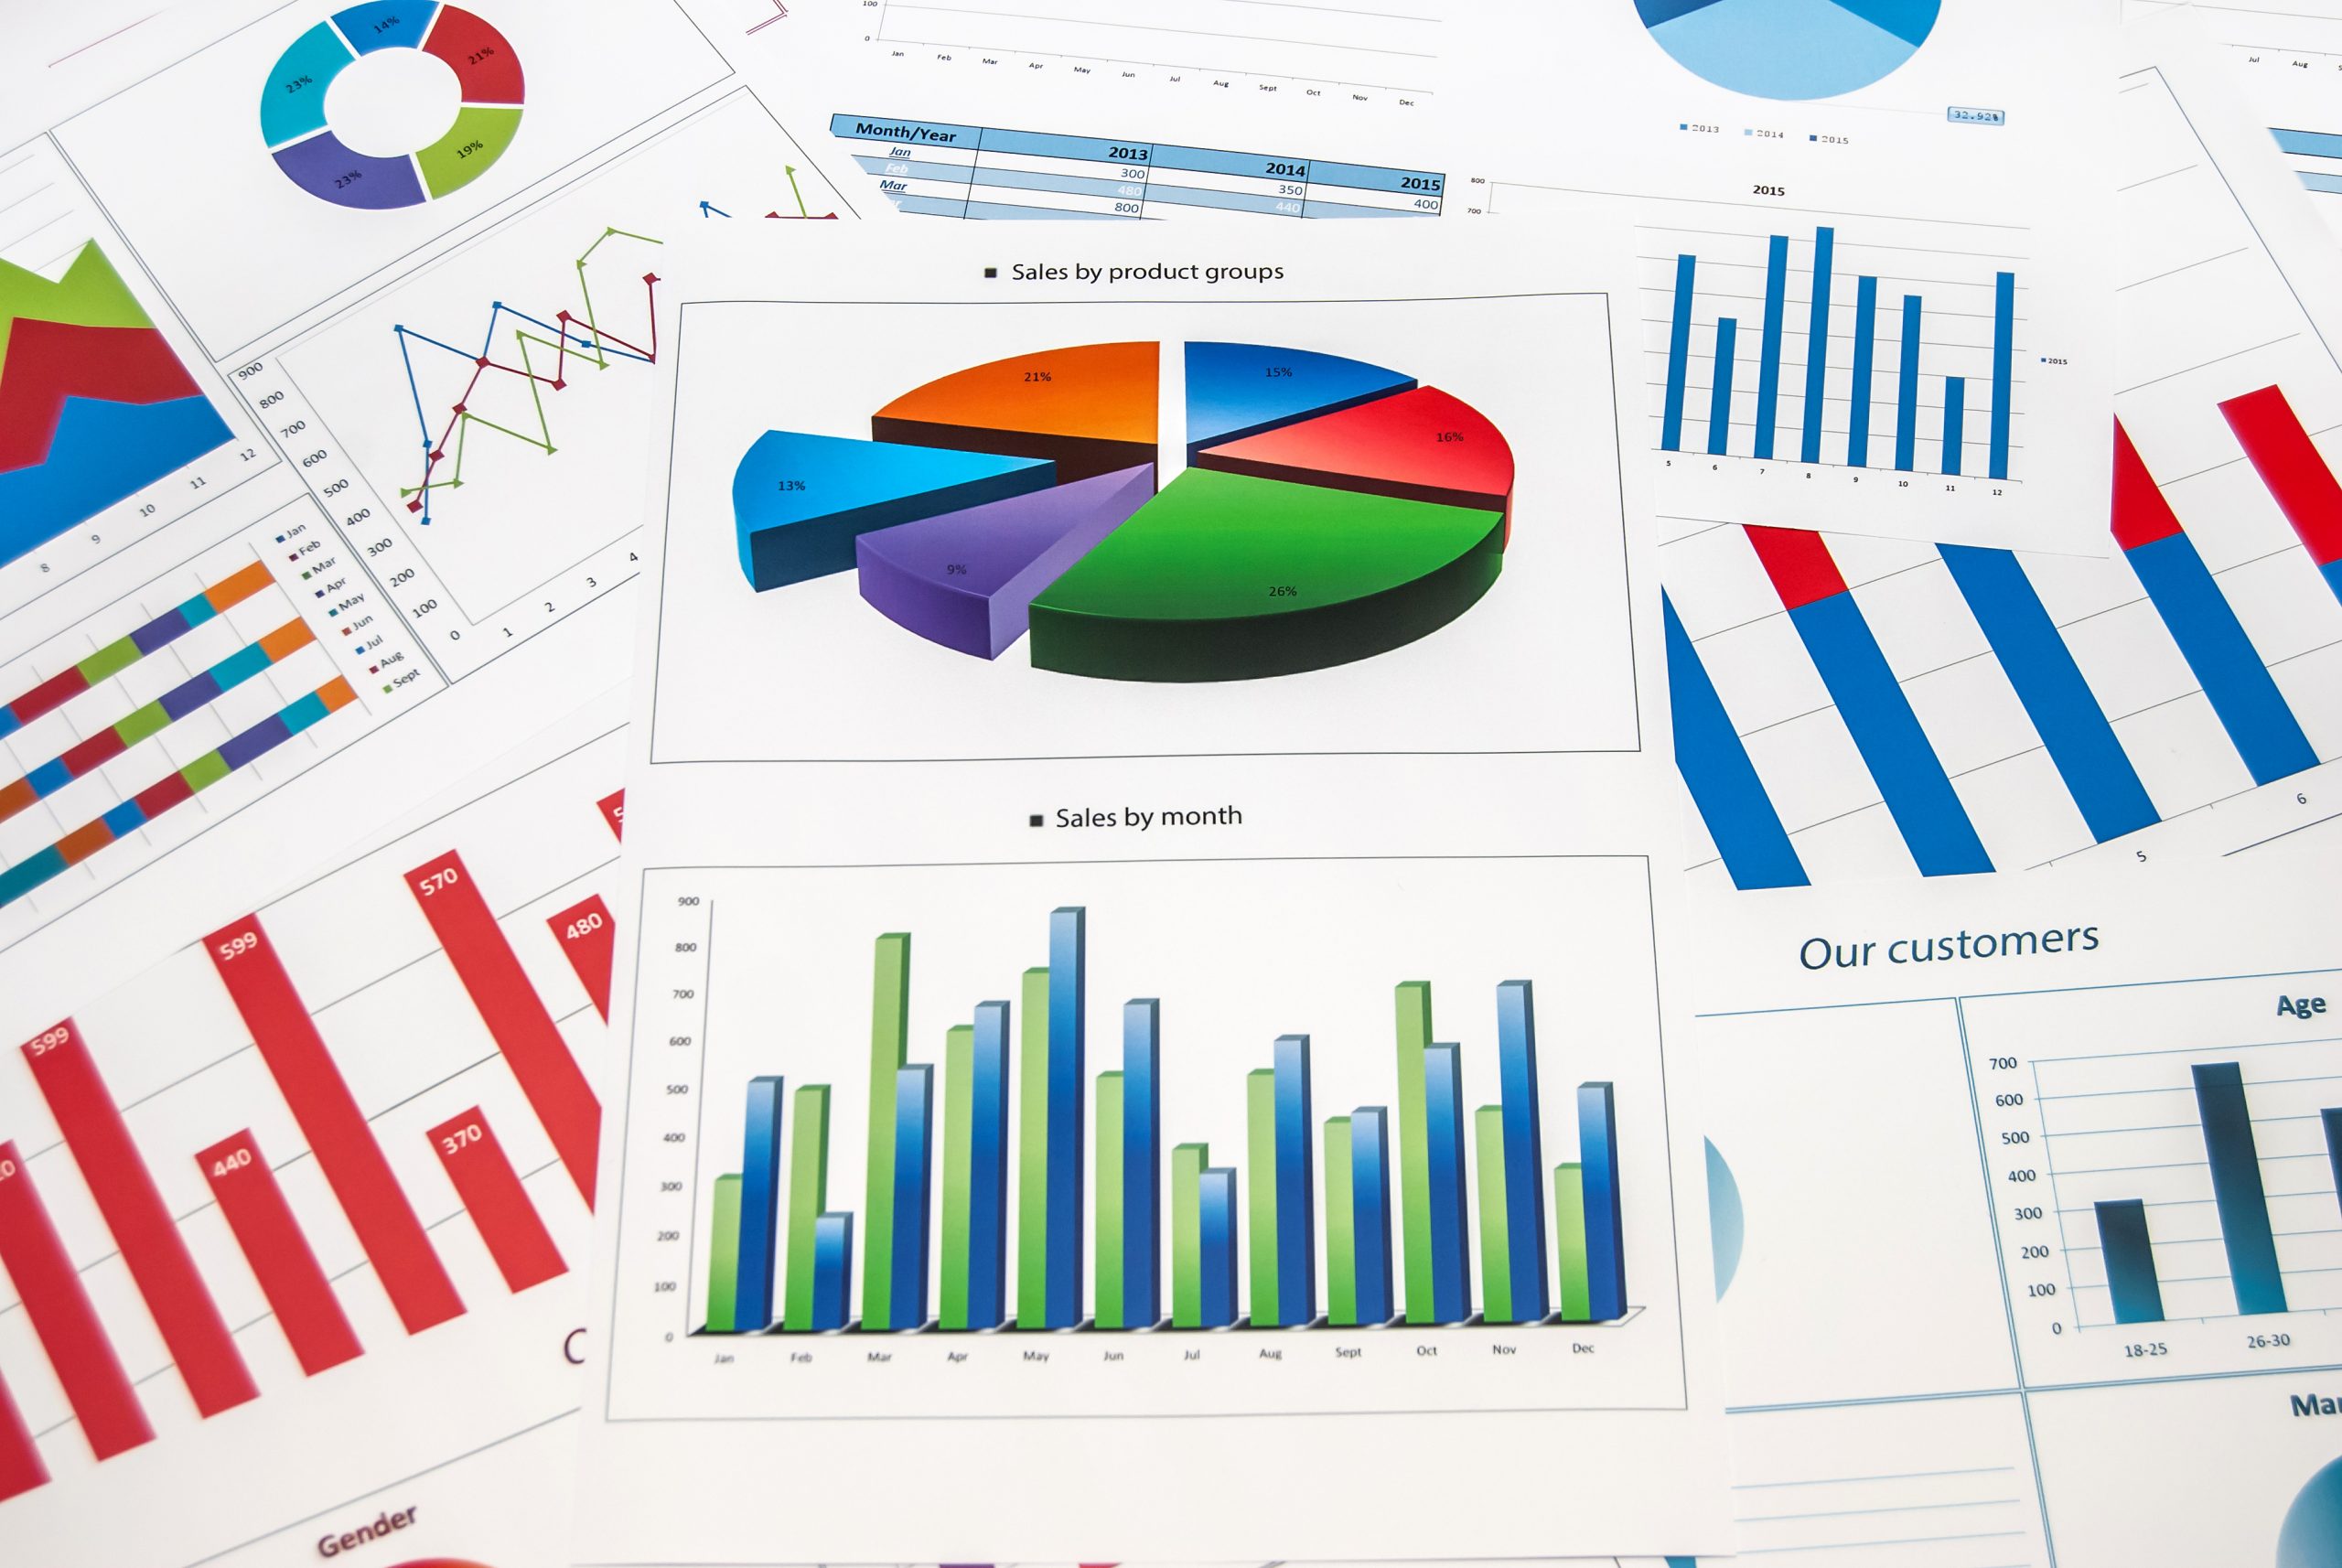
- Pie charts and stacked bar charts: These graphs offer a simplistic way to analyze data; Effortless in organization; Divided into sections, offers straightforward way to compare the size of each component
- Dashboards: Allow technical and non-technical users to understand reporting easier; Can track, analyze and display data points, metrics and KPIs
- Line graphs and area charts: Plotting a series of data points displays change in one or more quantities over time
- Histograms: This visual makes it easy to identify outliers within a given dataset; Graph plots a distribution of numbers using a bar chart, representing the quantity of data that falls within a particular range
- Scatter plots: Reveals relationship between two variables; Common within regression data analysis
- Heat maps: Graphic displays; Visualize behavioral data by location (location on a map, or even a webpage)
- Tree maps: Hierarchical data displayed as a set of nested shapes, normally rectangles
Five Ways Visualization Can Up Your Reporting
1. More Effective Reporting
The mind processes visuals 60,000 times faster than text descriptions. Data visualization allows for more effective reporting because visuals are processed more rapidly. The dashboards support visual learners who learn, absorb, and recall best by sight. It is reported that 65% of the population are visual learners. Content is faster and easier to comprehend when visualized.
2. Data Storytelling
Visualization supports data storytelling and helps the presenter make a more captivating case. Being able to effectively communicate using narratives and visualizations effectively allows for the presenter to connect with an audience and inspire action more easily.
3. Faster Report Generation
Visualization tools make it far easier and less time consuming for a data analyst to create compelling reports. Rather than manually sifting through large data sets to extract trends and create a way to relay this information, visualization can compile information quickly and illustrate important events in an aesthetically pleasing fashion.
4. Actionable insights
Data visualization is all about communicating insight. Using data visualization, organizations can clearly identify the peaks and valleys within their operations. They can illuminate success, but also identify areas that need improvement. Data visualization allows for easier transparency and honesty within reporting.
5. Helps increase revenue
A business equipped with data visualization capabilities will offer an ROI of $13.01 back on every dollar spent. That’s because visualizations improves decision making, hence, fewer costly mistakes are being made. However, a study revealed that on a global stage, only 26% used data visualization. For organizations that don’t currently use visualization, the knowledge, competition, and wealth gap will continue to grow between themselves and those who have already hopped on the data visualization train.

Visualizing your Future
Visualization allows for more efficient transfer of information within your organization, which will serve to make your business more efficient in general. With the amount of data available to organizations, visual reporting has become increasingly important to making better decisions faster. Making changes to legacy systems and reporting protocols might be uncomfortable, but the rewards far outweigh the risks. Making data more visual and intuitive can be the key that unlocks the door to digital success.
To learn more about data visualization, check out Apexon’s Digital Visualization services or get in touch with us directly using the form below.